What is the KT-High-Low-MT-Indicator for Forex Traders?
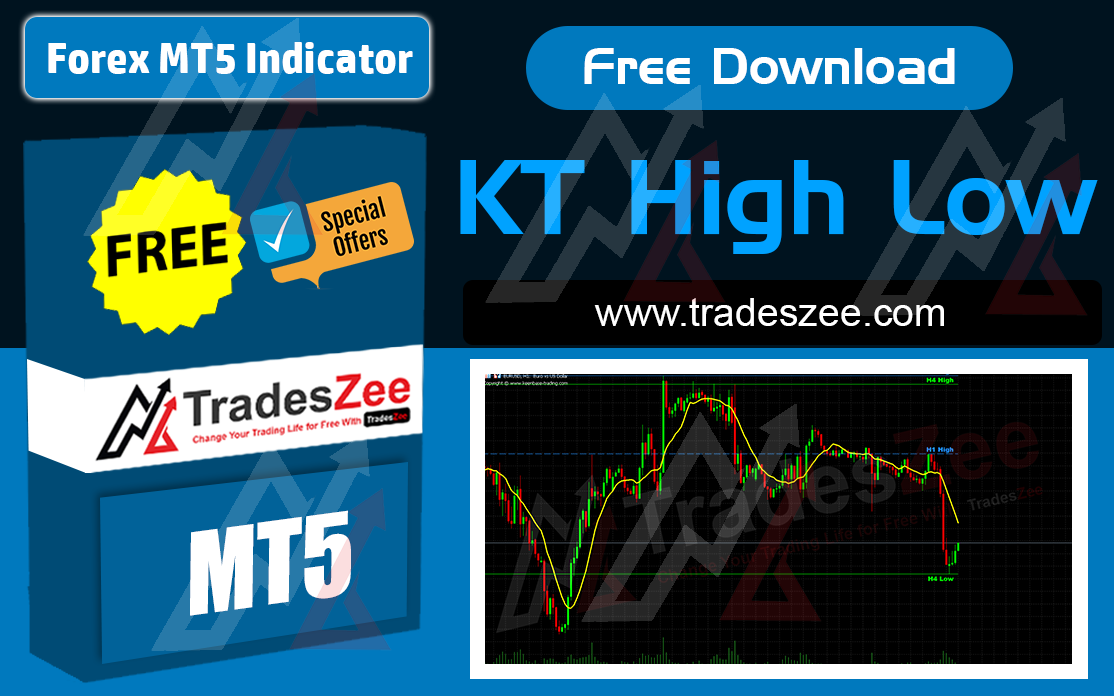
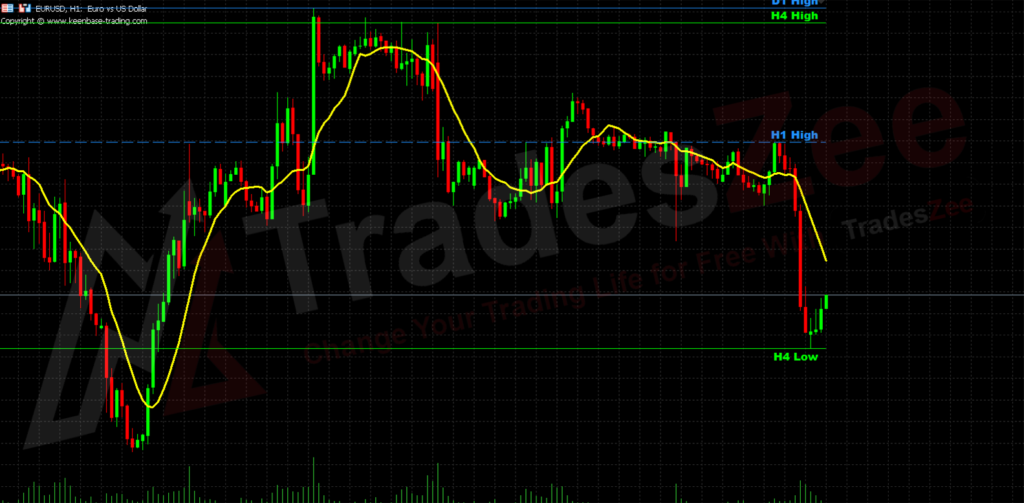
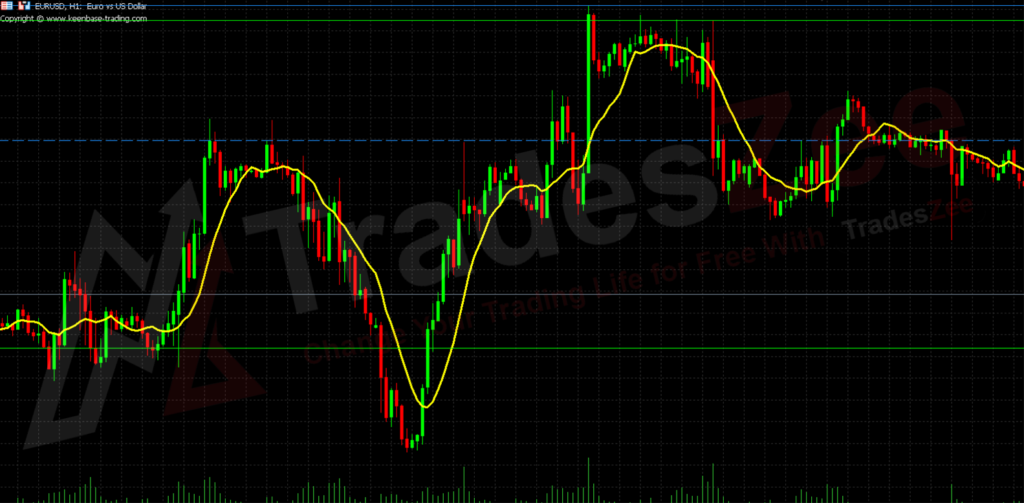
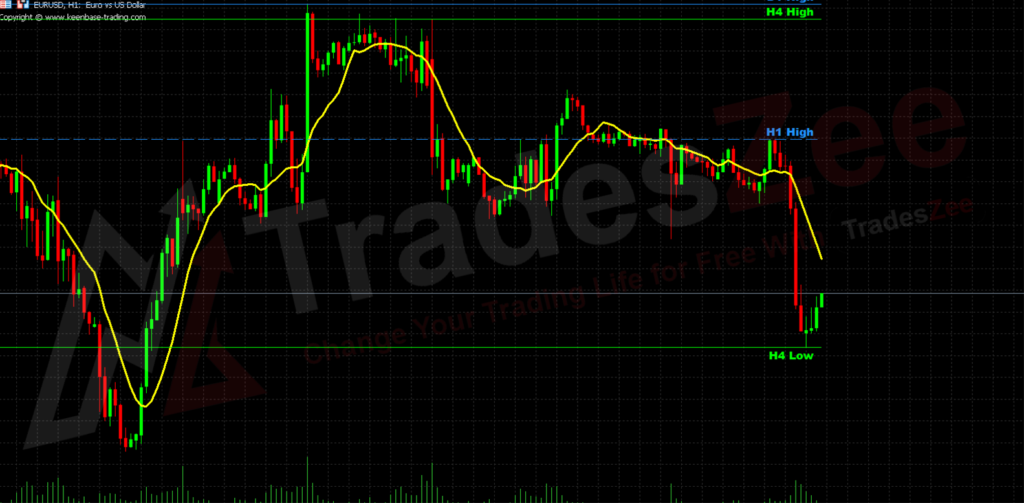
The KT-High-Low-MT-Indicator is a reliable MT5 Forex trading tool designed to provide accurate trendline analysis and mark significant high-low price zones. With its user-friendly interface, this indicator simplifies chart analysis, making it suitable for both beginner and professional traders.
Key Features:
- High-Low Zone Detection: Identifies the highest and lowest price points for better trend identification.
- Real-Time Trendlines: Automatically draws trendlines to indicate market trends.
- Ease of Use: Simple setup and intuitive display, making trading stress-free.
This indicator is an excellent choice for traders who want to make informed decisions without relying on manual calculations. It is particularly beneficial for scalpers, swing traders, and day traders focusing on high-precision entries and exits.Looking to sharpen your skills? Check out resources like the Tradeszee EDU Hub, which offers comprehensive tutorials and strategies tailored for tools like this one.
How the Indicator System Works
The KT-High-Low-MT-Indicator operates by analyzing past price movements to plot high and low zones, creating a clear visual map of market trends.
- Dynamic Trendlines: These lines adjust as market conditions change, offering up-to-date trend insights.
- Signal Alerts: Provides audio or visual alerts for price movements near high or low zones.
- Customizable Settings: Adjust colors, line thickness, and alert preferences for a personalized trading experience.
Indicator Settings Include:
- Timeframe selection for short-term or long-term analysis.
- Alert triggers based on price proximity to marked zones.
Methods to Improve the Indicator
Enhance the accuracy of the KT-High-Low-MT-Indicator with these tips:
1 . Combine with Other Indicators: Use moving averages or RSI for confirmation signals.
2 . Adjust Timeframes: Experiment with different chart timeframes to suit your trading strategy.
3 . Follow Market News: Monitor economic events to avoid trading during volatile periods.
What the indicator system includes
The indicator system includes many indicators, EAs, libraries, and files in addition to the mentioned indicators above. Here you can see everything included in the indicator system.
Indicators
- KT-Custom-High-Low.ex5
Templates
- KT High Low Mt5.tpl
Important links you need to refer before starting trading
- Learn Forex , Binary Trading and Cryptocurrency Trading Free
- How to download and install indicators , Expert Advisors (Robots)
- What you need to do before starting forex trading
- Tips to improve signal accuracy for this Forex indicator
Frequently Asked Questions for KT-High-Low-MT-Indicator
You may have more questions about this indicator. Refer to these FAQs to gain a better understanding of it
KT High Low MT Indicator FAQs
How to trade with the KT-High-Low-MT-Indicator
When taking trades using this indicator, consider the following.
How to Get BUY Trades
- Monitor the Low Zone :
- When the price approaches or touches the low zone, it indicates a potential support level where buyers may step in.
- Confirm with a Breakout Above the Low Zone :
- A buy signal occurs if the price breaks above the low zone and holds above it for a few candles.
- Retest of the Low Zone :
- After the breakout, watch for the price to retest the low zone and bounce upward. This retest adds confidence to the buy signal.
- Combine with Confirmation Indicators :
- Use tools like RSI to check if the market is oversold, signaling a reversal is likely.
- Candlestick Patterns :
- Look for bullish candlestick patterns such as bullish engulfing or hammer candles near the low zone.
- Set a Stop Loss and Take Profit :
- Place the stop loss just below the low zone to limit losses.
- Set a take profit at the next resistance level or according to your preferred risk-reward ratio.
How to Get Sell Trades
- Monitor the High Zone:
- When the price approaches or touches the high zone, it indicates a potential resistance level where sellers may become active.
- Confirm with a Breakout Below the High Zone:
- A sell signal occurs if the price breaks below the high zone and stays below it for a few candles.
- Retest of the High Zone:
- Watch for the price to retest the high zone and then move downward. This retest validates the sell signal.
- Combine with Confirmation Indicators:
- Use indicators like RSI to see if the market is overbought, signaling a downward reversal is likely.
- Candlestick Patterns:
- Look for bearish candlestick patterns such as bearish engulfing or shooting stars near the high zone.
- Set a Stop Loss and Take Profit:
- Place the stop loss just above the high zone to protect against unexpected moves.
- Set a take profit at the next support level or according to your risk-reward strategy.
These conditions, combined with proper risk management, can enhance the likelihood of successful trades.
Things to Avoid When Trading with This Indicator
Avoid the following pitfalls when trading with this indicator system
- Trading during low liquidity periods. This can lead to wider spreads and difficulty entering or exiting trades.
- Ignoring the overall market trend. The indicator should complement your existing trading strategy, not replace sound judgment.
Best Practices for trading with the indicator system
- Back test the indicator on historical data to assess its performance in various market conditions.
- Practice using the indicator on a demo account before risking real capital.
- Develop a comprehensive trading strategy that incorporates the FX Agency Indicator System with other forms of analysis and risk management techniques.
By following these steps, traders can improve their overall trading performance.
Download More Indicators for FREE
You can download more indicators, expert advisors and trading systems from this website for 100% free. Refer to the following links to get them
- Free Download MT4 Forex Indicators
- Free Download MT5 Forex Indicators
- Free Download MT4 Forex Expert Advisors (MT4 Forex Robots)
- Free Download MT4 Binary Options Indicators
- Free Download MT5 Binary Options Indicators
- Free Download eBooks for Traders
See more figures of KT-High-Low-MT-Indicator
Risk Disclaimer
FX Agency Indicator, and the information provided in this article is not financial or investment advice. Always practice proper risk management and never trade with more than you can afford to lose.
How to free download the KT-High-Low-MT-Indicator
You can download the indicator via the following download button.

